Temperature reading retrospectives & continuous learning
Inspired by Virginia Satir’s Temperature Reading, expanded with timelines for real organisational retrospectives
This choreography combines a factual sequence of events, the team’s shifting energy, and a structured reflection process. It grounds discussion in reality, captures both what happened and how it was experienced, and turns that into actionable learning.
The flow
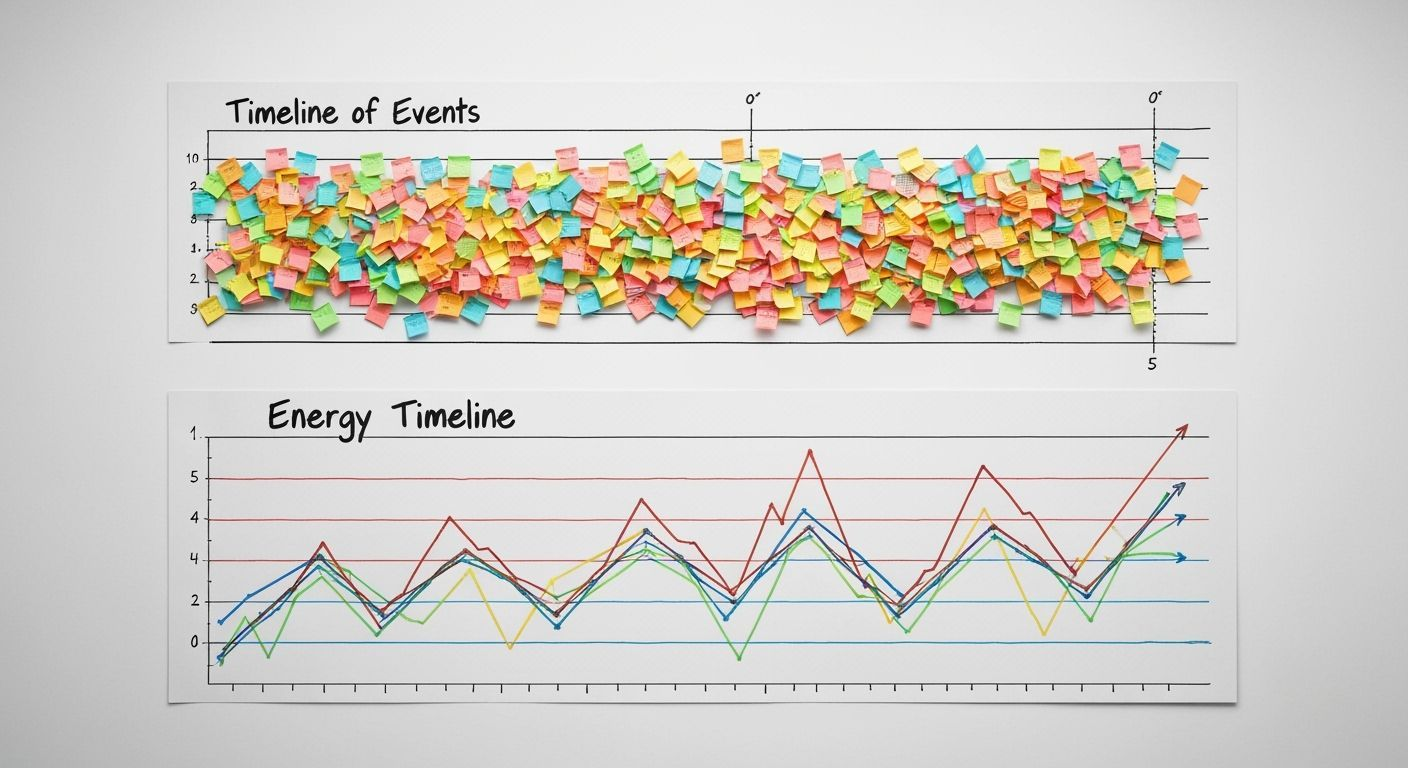
Timeline of events — map the key milestones, decisions, and incidents.
Energy timeline — layer in how the team’s energy rose and dipped along the way.
Temperature reading — reflect on what went well, what did not, what was learned, open questions, and next actions.
The result is a retrospective that surfaces hidden dynamics, strengthens collective insight, and builds the capacity for continuous learning and the next choreographies.